Summer
2018 Swiss GDP data update: like no other before |
|||||
|---|---|---|---|---|---|
The seco data revision, its reason
and its impact on GDP nowcasting |
|||||
 |
|||||
| «home | © Christian Müller 2018 | ||||
| the gap | Early last year a gap emerged between the «KOF surprise
indicator»
and the year-on-year growth rate of Swiss GDP published by the State
Secretariat for Economic Affairs (seco). A gap of that size and
duration has never been observed since the indicator's introduction in
2007. While the indicator signaled a significant expansion of the
Swiss economy, official estimates by the seco saw GDP hover around the
one percent mark only. |
||||
| The
figure below - first
published in February this year -
illustrates the puzzling difference between the indicator's information
and the seco data. The blue bars represent the official seco
year-on-year GDP growth rate and the green line the indicator
values as of February 2018. Obviously, while the indicator picks up at
the end of the sample, reported GDP growth remained stubbornly weak. |
|||||
 |
|||||
| Based on the clear signals sent by the «KOF surprise indicator» the first estimate for 2017 GDP growth amounted to 1.4 percent, which is just 0.2 percentage points short of the latest data release. These most recent GDP figures for 2017 are owed to the Federal Statistical Office's (FSO) first estimate of Swiss GDP published at the end of August. Consequently, the 2017 growth rate has been revised by no less than 0.5 percentage point, and hence by more than ever before in more than ten years. | |||||
| exceptional | The following graph compares all revisions of annual growth rates for Swiss GDP by the order of occurrance. The latest revision of the 2017 rate is the second revision since the initial release by seco in March 2018. Accordingly, the first revision was made in May this year when the estimated growth rate did not change as seems to have been the case for all first revisions in general. | ||||
| Apparently, the summer 2018 revision really stands out. It even outweighs the revision of the 2009 crisis year's growth estimate in absolute terms. | |||||
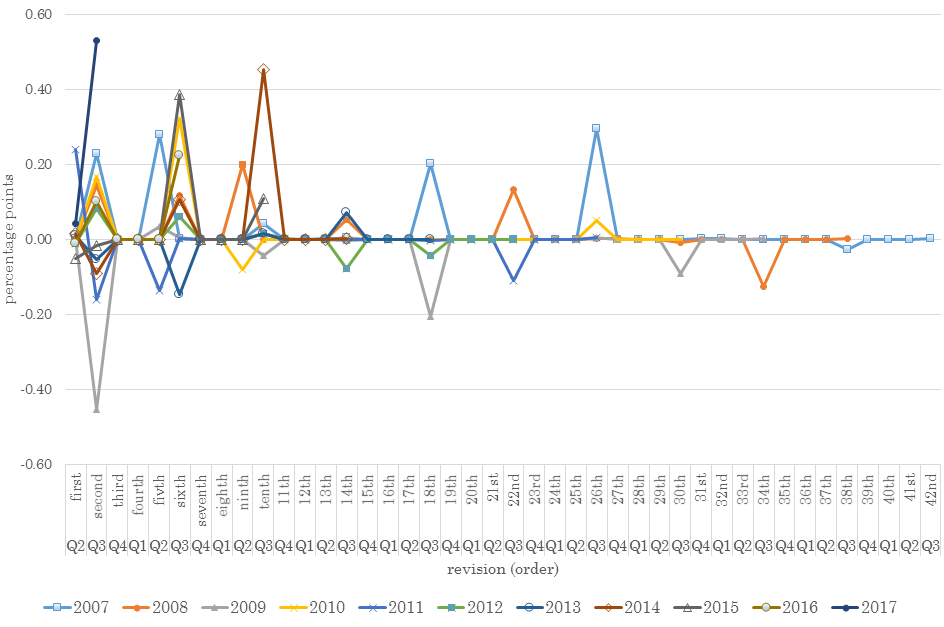 |
|||||
| This exceptional correction of preliminary data raises a number of questions such as what has caused the revision, what the implications for indicator-based nowcasting are and, finally, what could be done in order to avoid errors of this size. | |||||
| deflator troubles |
The
first of these issues can be answered by a comparison of the GDP
components before and after the revision. It turns out that in terms of
expenditures the largest difference of 5 percentage points (pp) before
and after the revision concerns gross investments growth. However, it
seems as if it is not the rate of investment expansion as such but the
deflator for gross investment that caused the large gap. This can be
seen by also comparing the revisions of nominal growth rates of the
various GDP expenditure components. In nominal terms, investment growth
revision (1.6 pp) is only second to the imports of services revisions
(1.8 pp) and hence also much smaller in size compared to the revision
of real investment data. |
||||
| The
answer to the second question is a bit more challenging. On the one
hand, seco preliminary data releases have been shown to be informative
for the eventual final data compiled by the FSO. Owed to this, most
independent researchers base their forecasts on seco's preliminary
estimates. On the other hand, however, as a consequence of using seco's
preliminary data, the deficits of this data carry over to the
alternative estimates making it very difficult to systematically
improve early bird forecasts. |
|||||
| robust indicator |
The estimates based on the «KOF
surprise indicator» are a case in point: Despite the strong
indication of very dynamic GDP growth throughout 2017, the actual
growth estimates remained underwhelming compared to the current state
of knowledge. The first growth estimate of 1.4 percent in February was
greatly influenced by economic figures as of December 2017 showing a
rather poor performance of the Swiss economy. It is not clear, however,
if a longer-term forecast that does not rely on seco's preliminary
estimates would have delivered better results. This question,
therefore, remains the subject of future research. |
||||
| Although large data revisions are not really desirable, they also have their benefits because they afford a test of the relevance of alternative business cycle evaluation methods. Again, the «KOF surprise indicator» yields some lessons. When the aforementioned gap opened, the question arose of whether or not it would eventually shrink. If it would, the indicator - once again - would have found support. The following figure does the test. | |||||
|
|||||
| too optimistic? |
The «KOF surprise
indicator» (in blue) compares considerably better to the
latest GDP estimates (in red) than to the preliminary values (in
black). As a consequence, the gap between indicator and GDP values as of 2017
narrowed significantly upon the new release. This reduction is shown as a
green area between old and new GDP data. Interestingly, a new gap with inverted roles is currently
opening. This new difference between preliminary GDP data for 2018 and
the «KOF surprise indicator» seems to imply that
seco's provisional 2018 data might indeed be too optimistic. Hence, according
to the «KOF surprise indicator» there is good
reason to believe that 2018 growth will break records but the final
figure may well be lower than it currently seems. |
||||
| bottom-up v top-down |
Finally, one may wonder what
seco could or should do in order to avoid severe revisions such as the
last one. For one, the summer 2018 revision cannot be attributed to
some important exogenous shock as it could be back in 2009/2010.
Therefore, the standard procedures for estimating GDP have to be
scrutinized. The standard is to calculate GDP bottom-up with the
various GDP components being approximated by several indicators. Other
suggestions notwithstanding, a potentially useful alteration of the
standard procedure could be to cross-check the bottom-up results with
top-down estimates. The «KOF surprise indicator»
handsomely testifies to the insights that can be gained by top-down methods. |
||||
| «home | |||||
| © Christian Müller 2018 | |||||
| Jacobs University Bremen | |||||
| www.s-e-i.ch | |||||